SQLMS ETL process and visualization project for E-commerce wholesales company
Through various skills, I developed the next project that answers questions about the sales of multiple customers for a top wholesale company, demonstrating relationships between tables, the creation of information tables in SQL Server, and visualization in Power BI.
ETL process to optimize reporting and dashboard, also delivering information tables.
Through Kaggle, I downloaded data from 2016 to 2018 from a leading wholesale company in Brazil. The objective was to analyze the category and sales behavior over this period. Using SQL for data management and Power BI for analysis and visualization, I was able to generate valuable insights to support business strategy and product development.
I discovered some geographical inconsistencies with special characters generating inaccurate information, through SQL I could clean this information and use the state as an accurate field to group the information accurately.
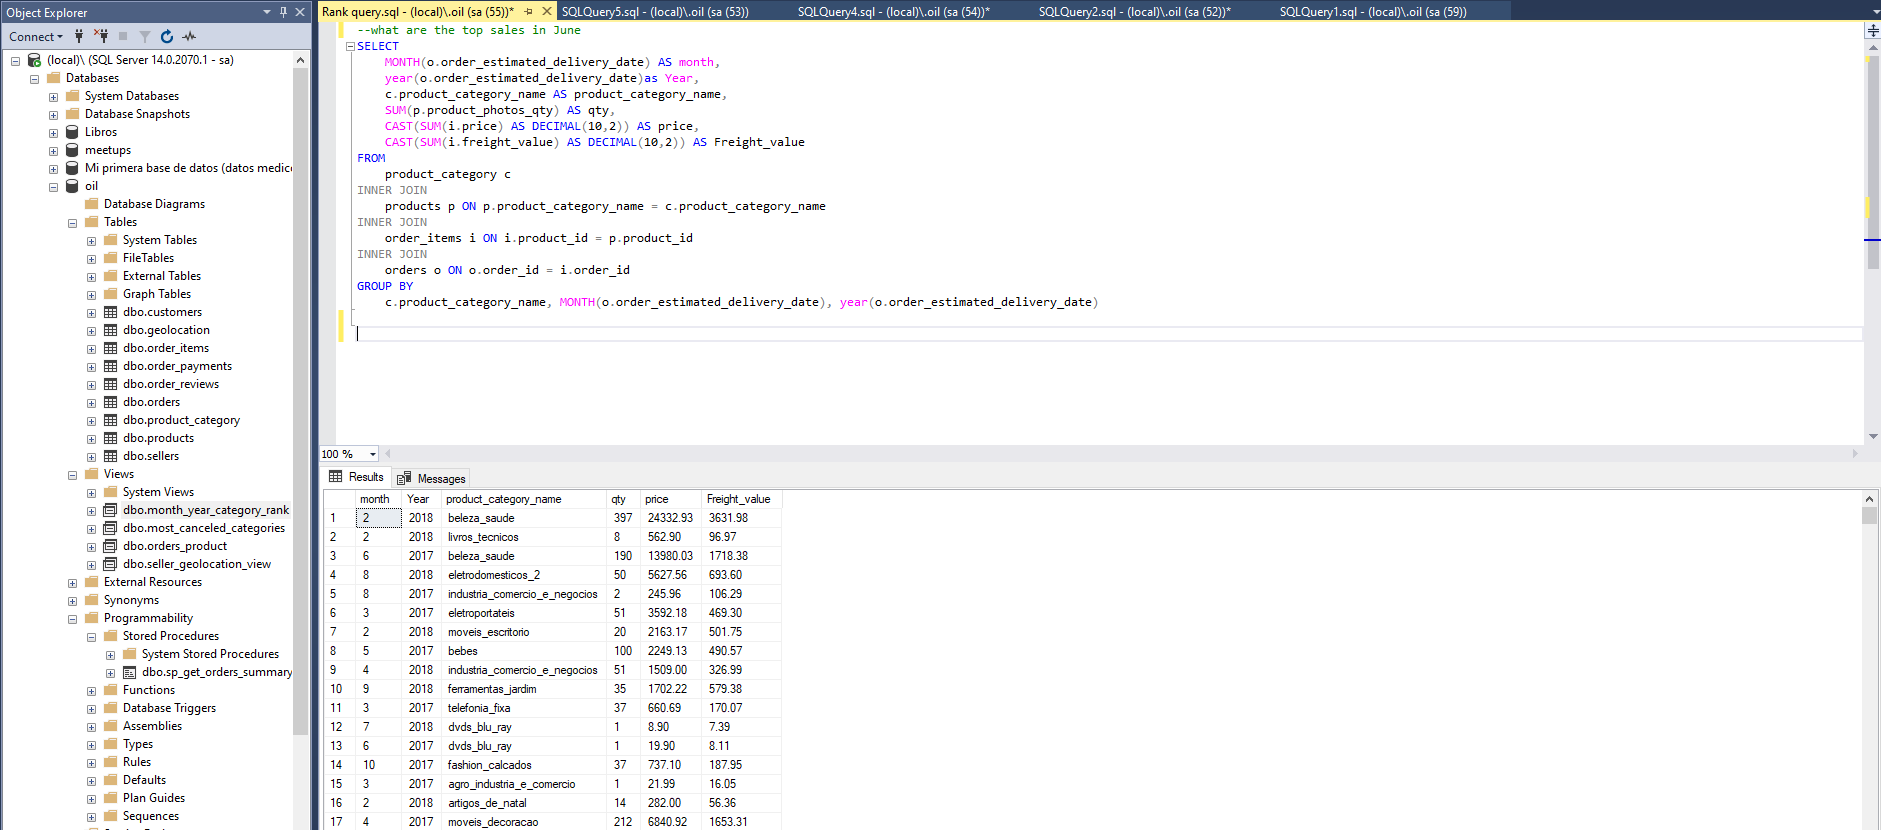
Creating information tables based in your needs
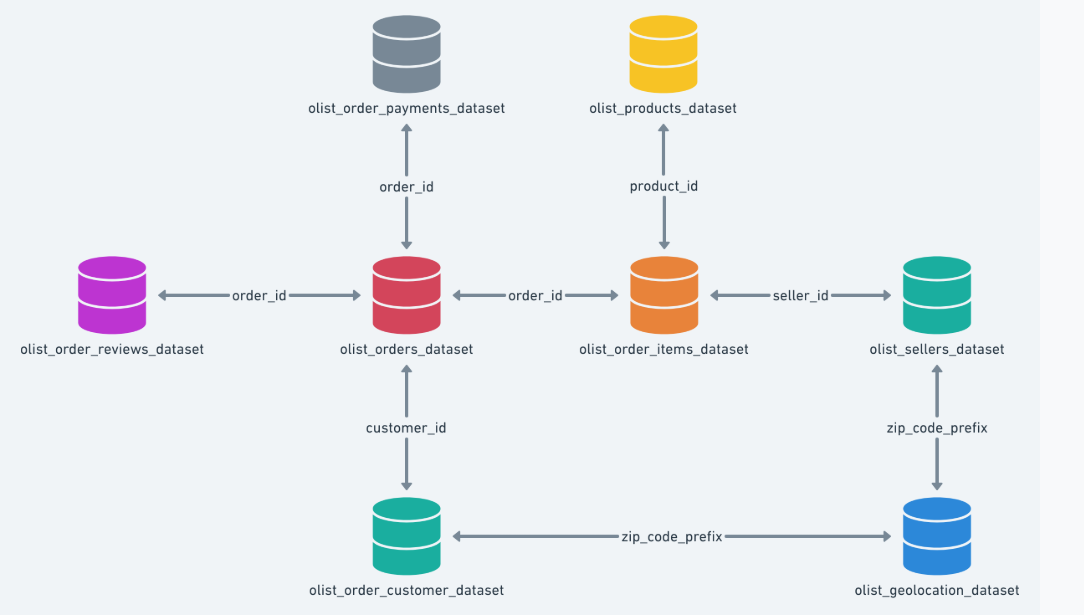
DRL modeling between multiple tables
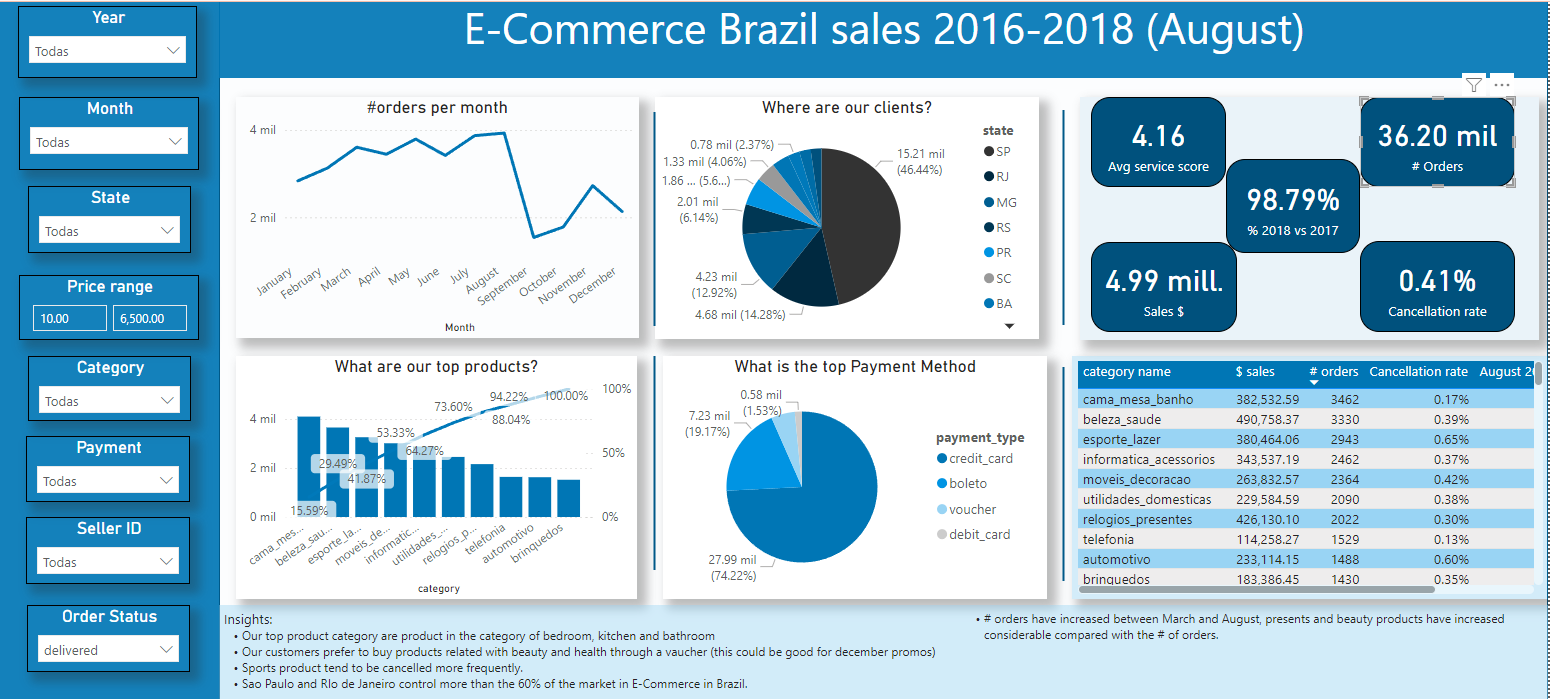
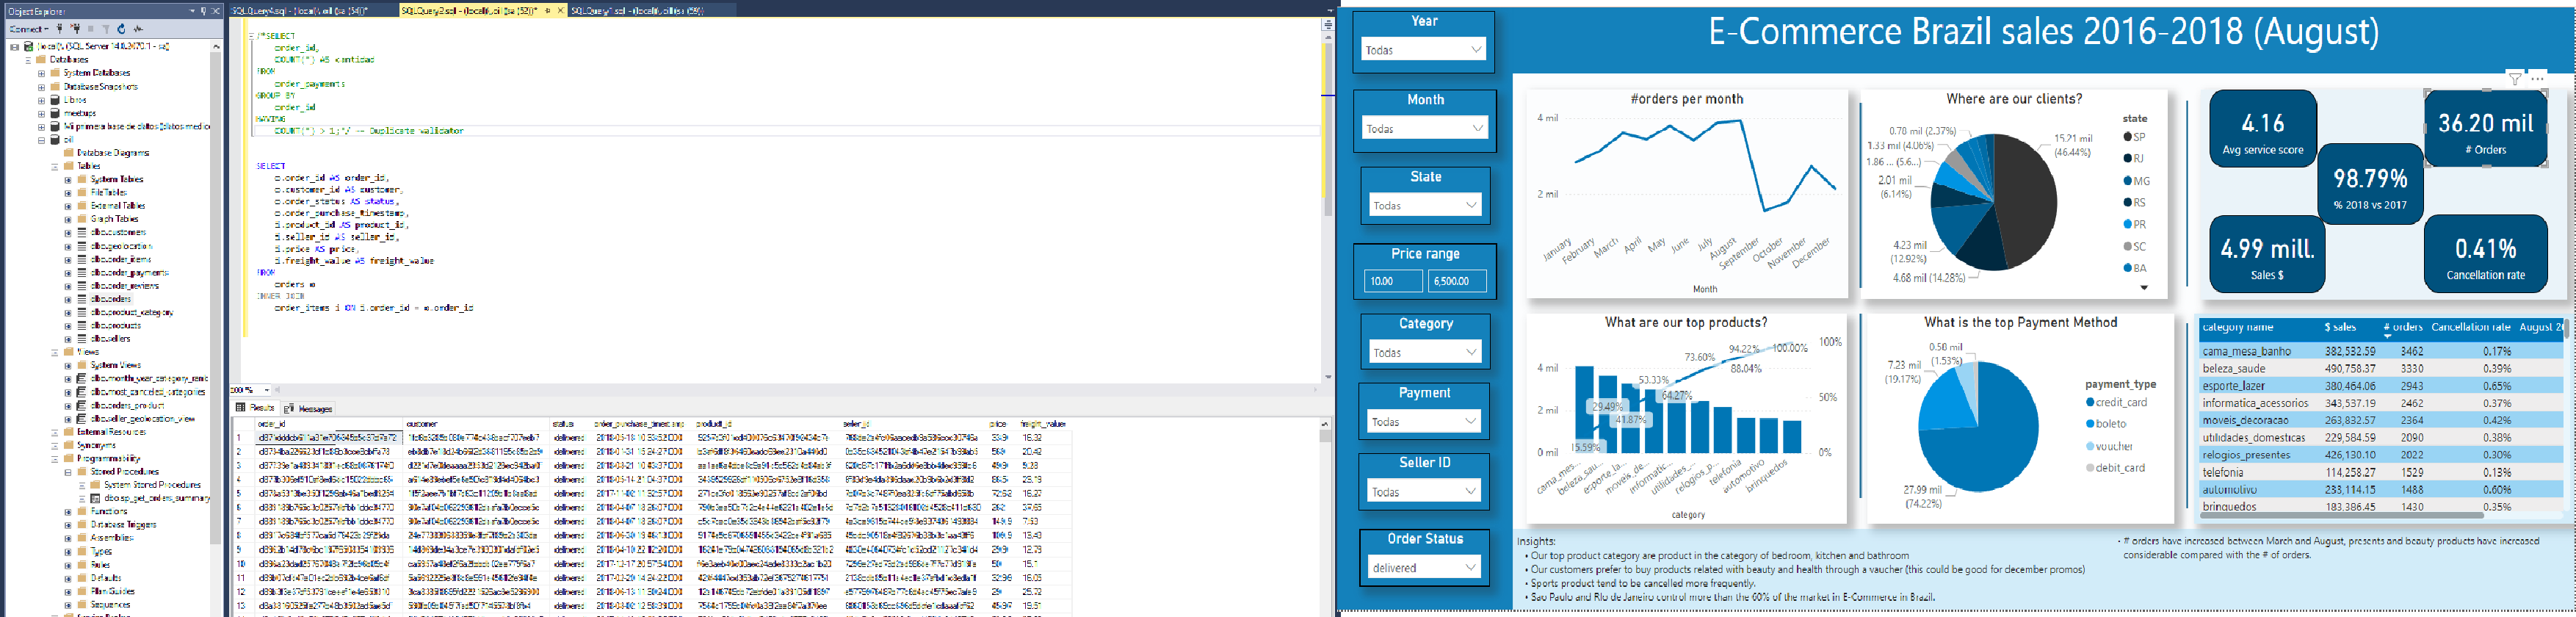
Insight development through KPI visualization.
- Analyzing the impact on sales based in our categories, I recommend focusing on opening new markets or product developments based in historical data.
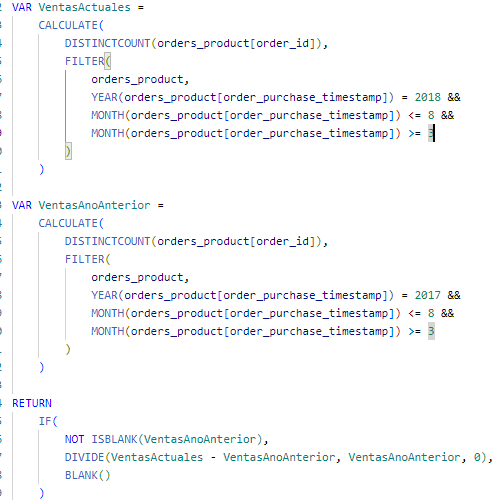
My comprehension to manage KPI´s and calculation give a different perspective and adaptation to the times, using calculation in DAX to bring comparative dates KPIs.
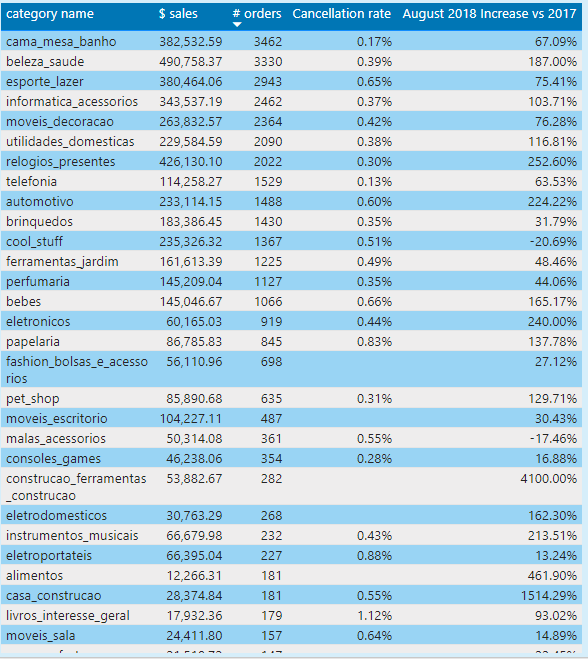
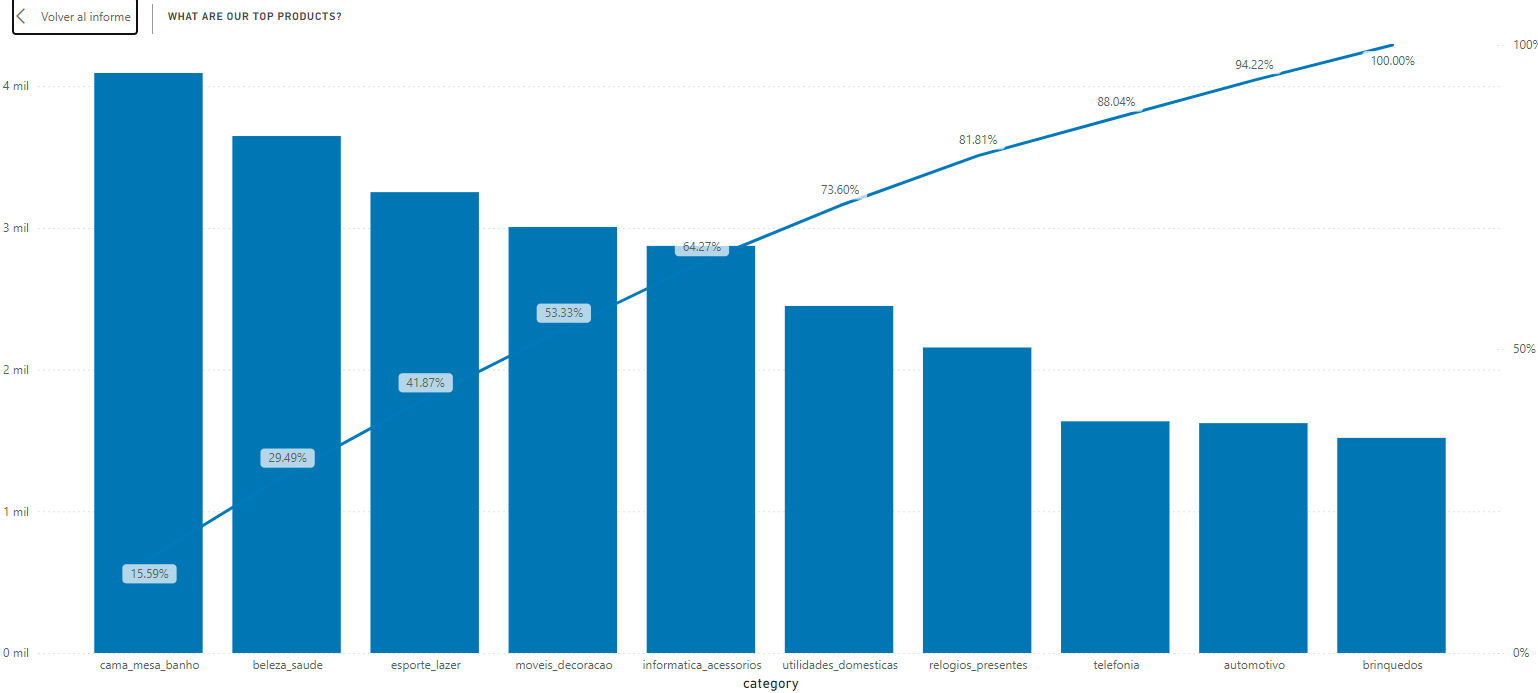
2. What are the client’s top products, and how much is the cancellation rate?